

Electric mobility: how much does the electricity source matter?
Lorenzo Martini, 10/08/2026
Well-to-wheel efficiency, scenario by scenario
In short. The electric motor beats the combustion engine for reasons of physics, and that advantage depends on nothing else: for the same energy put into the vehicle, an electric car travels about three times as far as a petrol car. The well-to-wheel balance, however, is not a property of the car but of the electricity system that powers it: on coal-fired electricity an EV is as efficient as a petrol car and less so than a diesel; on the 2024 European mix it achieves about 28%, against 17% for petrol and 21% for diesel; on renewable electricity it exceeds 55%. This article rebuilds the chain stage by stage, with central values, ranges and sources, showing how the result changes as the source changes.
1. The right question
“Is an electric car really more efficient than a petrol one?” is a question that gets opposite answers depending on who asks it, and often both sides are right, because they are talking about two different things.
The first is Tank-to-Wheel efficiency (from the tank, or the battery, to the wheel): here the electric car wins for thermodynamic reasons that no energy-policy choice can change. The second is Well-to-Wheel efficiency, which includes everything that happens before the socket: extraction, generation, transmission, charging. Here the result depends on the source of the electricity, and can range from “worse than a diesel” to “three times better than a petrol car”.
The aim of this article is to keep the two apart and give the reader the numbers to reason with: how much the electric motor’s intrinsic advantage is worth, how much of it is lost upstream of the socket in different generation scenarios, and where Europe stands today.
2. Definitions and conventions
-
Well-to-Tank (WTT): from the primary source to the energy carrier on board the vehicle. For a combustion car: extraction, refining, distribution. For an EV: fuel supply to the power plant, generation, transmission and distribution, charging up to the energy stored in the battery.
-
Tank-to-Wheel (TTW): from the energy on board to the actual traction: motor, transmission, auxiliaries.
-
Well-to-Wheel (WTW): the product of the two: WTW = WTT × TTW. A single inefficient link lowers the whole product, and this is the central point of the article.
A convention worth stating. For non-combustible sources (hydro, wind, photovoltaic) primary energy is counted, by statistical convention (the “physical energy content” method used by the IEA and Eurostat), as equal to the electricity produced: a generation efficiency of 100%. This is not a physical claim – a photovoltaic module converts about 20% of the incident radiation – but a sensible accounting choice: wind and sunlight are not “consumed”. Under the same convention nuclear instead enters as fission heat converted with an efficiency of 33%, because it is in every respect a steam-cycle thermal plant. This detail, often overlooked, changes the results significantly (section 7).
All values are on a lower-heating-value basis, refer to a mixed driving cycle, and concern energy, not CO₂ emissions (which depend on the carbon intensity of each source and follow a different logic, section 8).
3. The advantage that does not depend on the source: Tank-to-Wheel
Electric vehicle. According to the US Department of Energy (DOE, 2024), an EV delivers 65–69% of the energy drawn from the battery to the wheels; counting regenerative braking (about 22% of the energy over the EPA combined cycle) the equivalent efficiency rises to 87–91%. Upstream there is charging: ADAC tests on five recent models measure losses from the socket to the battery below 7% with a wallbox at full power, and around 15% (up to almost 25% in the worst case) with a 2.3 kW domestic socket; JEC WTW v5 assumes an average of 15% for 2025+. Taking 90% for charging and 67% for the battery-to-wheel conversion, the electric TTW from the socket to the wheel is about 60% (55–72%).
Combustion vehicle. For a conventional petrol car the share of fuel energy that reaches the wheels over a mixed cycle is 16–25% (DOE), approaching 30% for the latest engines; 22–30% for a diesel; 27–33% for a petrol hybrid. The peak efficiencies of the best engines (above 40%) are only reached at the optimum point of the engine map, not over a real driving cycle.
The factor of three. JEC WTW v5 (JRC, EUCAR, Concawe, 2020) quantifies, for 2025+, an energy consumption at the vehicle’s “tank” that is 70% lower for the electric vehicle than for the equivalent petrol car. In concrete figures: 16–18 kWh/100 km at the socket (58–65 MJ) against 6 L/100 km of petrol (about 193 MJ): a ratio of 3–3.3. This is the intrinsic advantage, and it holds whatever the source of the electricity.
4. The chain upstream of the socket: the parameters
The table collects the values used in the calculations, with the plausible range and the source. The central values are those used in the figures.
| Stage | Central value | Range | Source / note |
|---|---|---|---|
| Fuel supply to the plant (extraction, processing, transport) | gas 90%; coal 95% | gas 86–95%; coal 92–97% | Albatayneh et al. 2020 (literature review); in line with the JEC chains |
| Coal plant | 38% | 33–45% | Average efficiency of the EU fleet (IEA Clean Coal Centre); best units 45–47% |
| Combined-cycle gas plant | 55% | 50–62% | US fleet heat rate 2022 (EIA) converted to LHV; new H-class units above 60% |
| Nuclear plant | 33% | 33–37% | IEA/Eurostat convention for calculating primary energy |
| Hydro, wind, photovoltaic | 100% | – | Accounting convention (section 2); for PV it includes the inverter |
| Bioenergy | 30% | 25–35% | Biomass/biogas thermal plants |
| Transmission and distribution grid | 93% | 90–95% | CEER Power Losses Report 2025 (2022 data): transmission 1–4%, distribution typically 2–8% |
| Charging (socket → battery) | 90% | 85–93% | ADAC 2026 (wallbox with losses below 7%, domestic socket 15–25%); JEC TTW v5: 15% for 2025+ |
| Battery → wheels (discharge, inverter, motor, gearbox, auxiliaries) | 67% | 60–75% | DOE 2024: 65–69%; high end with regenerative braking in the urban cycle |
Regenerative braking was left out of the central value because it depends heavily on the driving cycle: on the motorway it is worth little, in town a lot. The high end of the battery-to-wheel range represents it.
5. The benchmark: the combustion car
For combustion vehicles the chain is shorter and, upstream of the tank, very efficient; the bottleneck is the engine.
| Vehicle | WTT (well → tank) | TTW (tank → wheels) | WTW | Notes |
|---|---|---|---|---|
| Petrol | 82–83% | 20% (16–25%) | 17% (13–21%) | Extraction ~95%, refining ~88%, distribution ~98% |
| Diesel | 82–83% | 25% (22–30%) | 21% (18–26%) | JEC WTT v5 attributes to European diesel a slightly higher refinery burden than petrol (7.2 against 5.5 gCO₂/MJ): diesel’s advantage is entirely in the engine |
| Petrol hybrid (HEV) | 82–83% | 30% (27–33%) | 25% (22–28%) | Regenerative braking and a combustion engine kept close to its point of maximum efficiency |
One observation: refining, often cited as oil’s great hidden inefficiency, actually costs 10–12% of the energy. The WTT of a fossil fuel is better than that of any thermal-generated electricity; it is the engine that throws away two thirds of what it receives.
6. The scenarios: the same car, six different sources
Applying the parameters of section 4 to the same electric car (socket-to-wheel 60%) gives the following results. For each scenario the explicit product is shown, so that anyone can redo or challenge the calculation.
| Scenario | Chain (central values) | WTW | Range |
|---|---|---|---|
| EV – coal-fired electricity | 0.95 × 0.38 × 0.93 × 0.90 × 0.67 | 20% | 14–29% |
| EV – nuclear electricity | 0.33 × 0.93 × 0.90 × 0.67 | 19% | 15–25% |
| EV – combined-cycle gas | 0.90 × 0.55 × 0.93 × 0.90 × 0.67 | 28% | 20–39% |
| EV – 2024 EU electricity mix | 0.49 × 0.93 × 0.90 × 0.67 | 28% | 23–33% |
| EV – renewables via the grid | 1.00 × 0.93 × 0.90 × 0.67 | 56% | 46–66% |
| EV – rooftop photovoltaics, wallbox | 1.00 × 0.93 × 0.67 | 62% | 51–70% |
| Petrol (reference) | 0.825 × 0.20 | 17% | 13–21% |
| Diesel (reference) | 0.82 × 0.25 | 21% | 18–26% |
| Petrol hybrid (reference) | 0.825 × 0.30 | 25% | 22–28% |
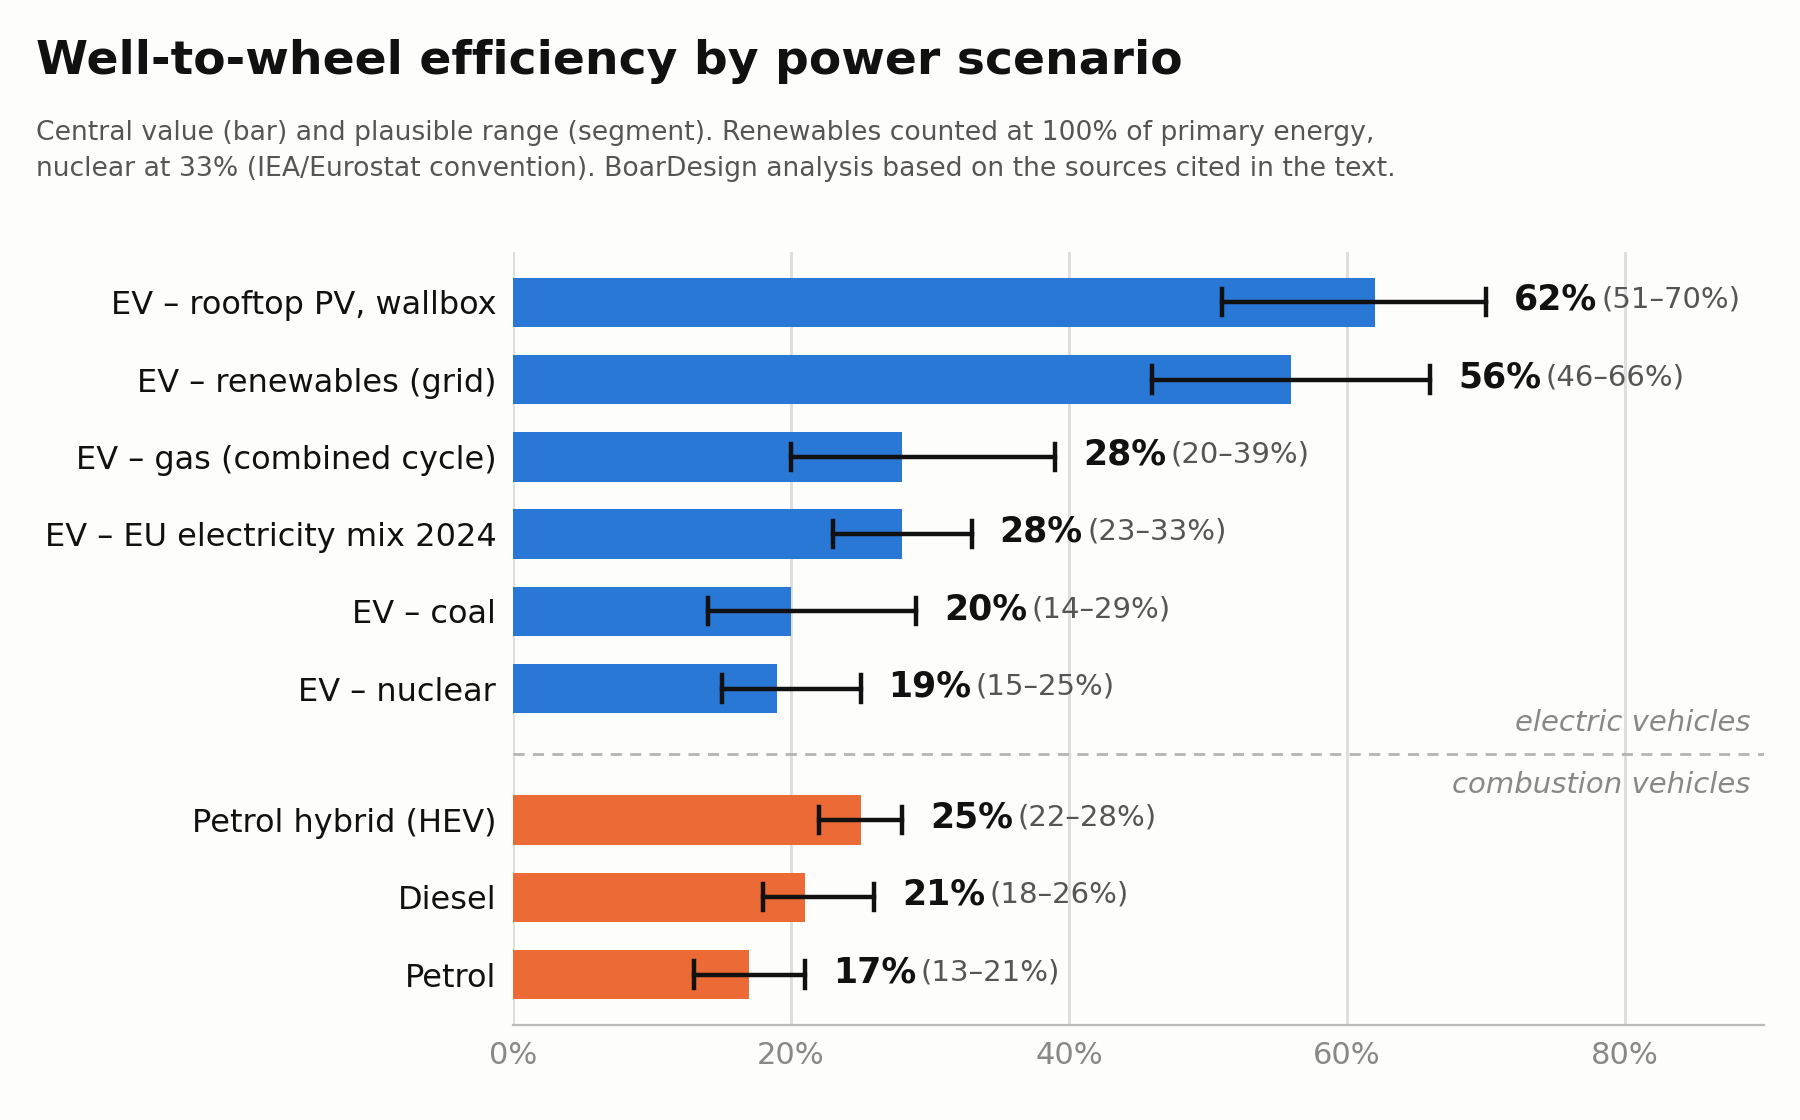
Three things stand out. First: with entirely fossil electricity, the electric car is as efficient as a petrol car and less so than a diesel or a hybrid; this is the same result reached by Albatayneh et al. (2020), who conclude, verbatim, that “diesel cars are more efficient than electric cars powered by fossil fuels”. Second: nuclear, from the point of view of energy efficiency, sits with coal, not with renewables: it is low-carbon, not low-loss. Third: the real leap only happens when thermal conversion disappears, that is, with hydro, wind and photovoltaics.
7. Where Europe stands: the 2024 electricity mix
In 2024 the European Union generated 47% of its electricity from renewables (hydro 13%, wind 17%, solar 11%, bioenergy and other about 6%), 24% from nuclear, 16% from gas, 10% from coal and 3% from other fossil fuels; low-carbon sources, renewables plus nuclear, therefore reach 71% (Ember, European Electricity Review 2025).
Weighting each source by its generation efficiency (hydro/wind/PV 100%, nuclear 33%, gas 55% with supply at 90%, coal 38% with supply at 95%, bioenergy 30%, other fossil 33%) gives an average primary-to-electricity efficiency of 49%. From this comes the cascade in figure 3: 49% at the power plant, 46% at the socket, 41% in the battery, 28% at the wheels.
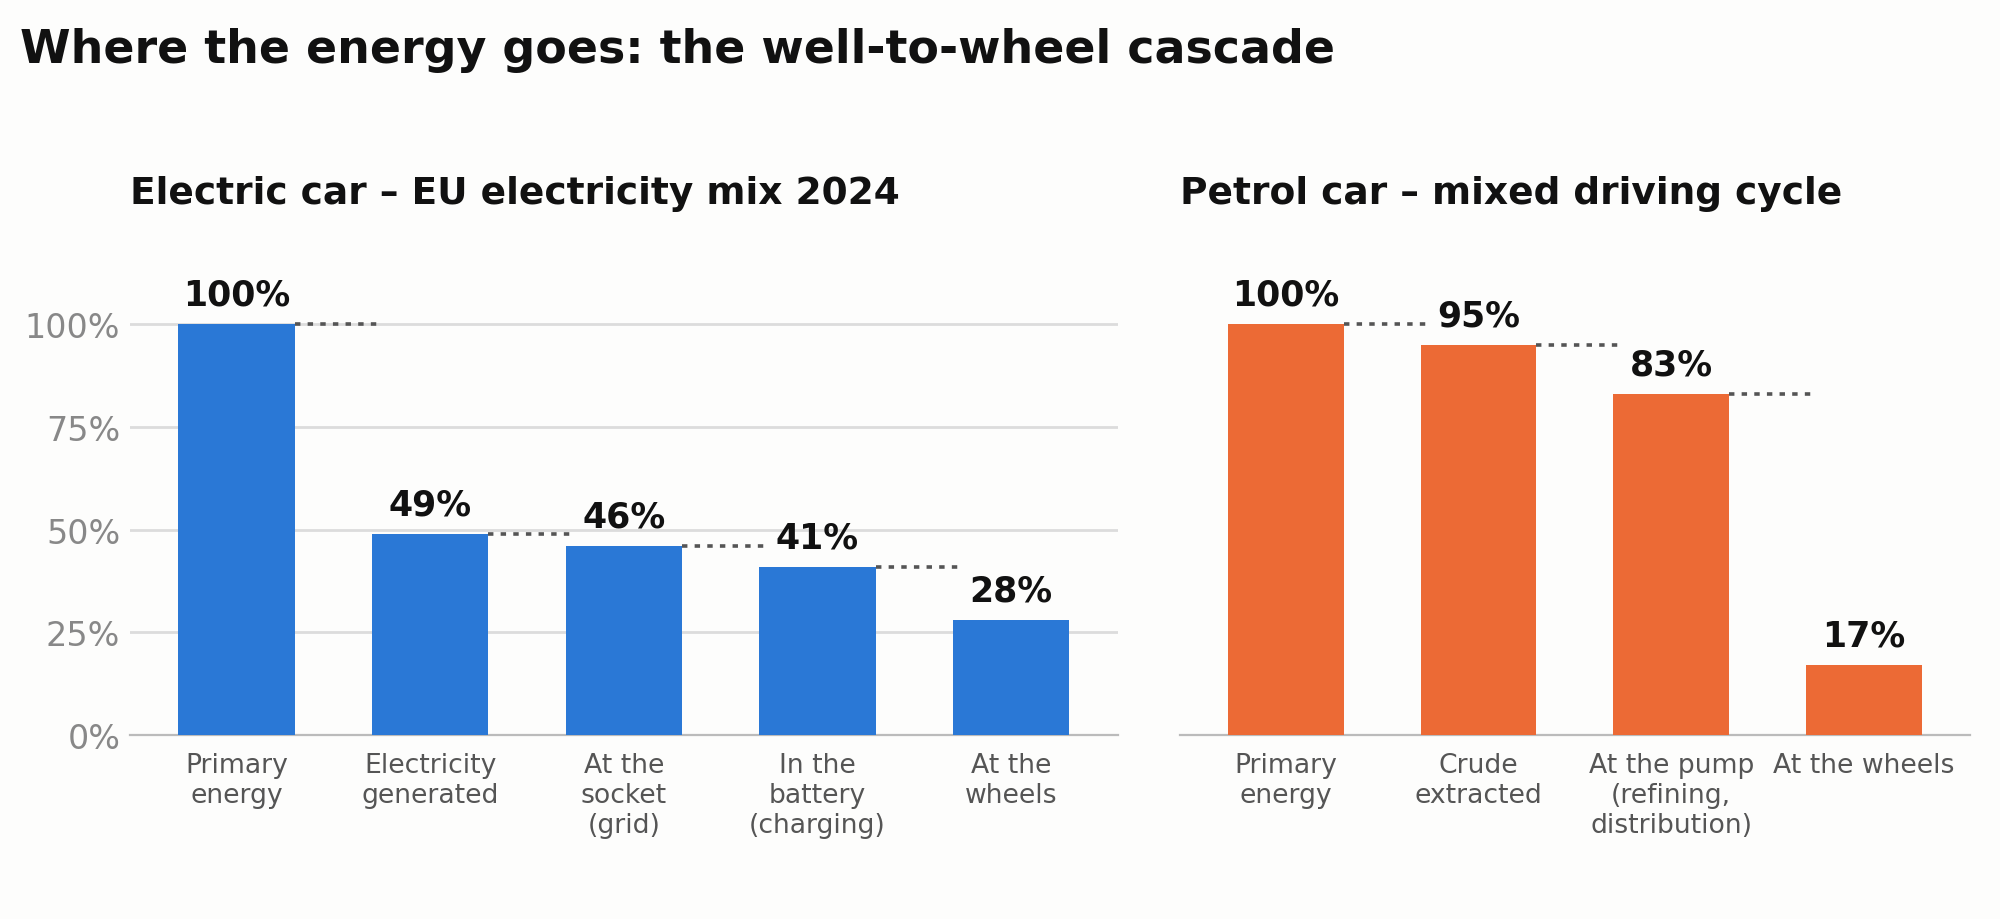
Beware of a common misunderstanding. “71% low-carbon” does not mean “71% free of conversion losses”. For energy efficiency, what counts is the 41% of hydro, wind and photovoltaics; nuclear enters at 33% like any thermal plant. If the alternative convention were adopted (the direct-equivalent method, with nuclear counted at 100% like renewables) the EV’s WTW on the EU mix would rise to about 45%: the accounting would change, not the physics. This article uses the IEA/Eurostat convention, which is more conservative.
The picture is moving: the renewable share of EU electricity was 34% in 2019 and is 47% in 2024. Every extra point of renewables raises the average WTW of the electric car, while the WTW of the combustion car has been stuck for decades and can only improve through hybridisation.
8. Reading the results
-
Final energy (at the socket or at the pump): the EV consumes about a third. This is a physical fact, independent of the source, and translates directly into running costs and into the need for distribution infrastructure.
-
Primary energy with the 2024 EU mix: EV at 28% against 17% petrol, 21% diesel, 25% hybrid. The advantage is real (+65% over petrol, +35% over diesel) but, compared with a good hybrid, modest. Anyone who says “electric is three times more efficient” is right only about final energy or about an entirely renewable mix.
-
Primary energy with renewables: 56–62%, i.e. 2.5–3.5 times petrol. This is the scenario towards which the European electricity system is heading, and the only one in which the factor of three also holds from the well.
-
CO₂ emissions: these follow another logic, because a nuclear or renewable kWh emits almost nothing regardless of conversion efficiency. Here the EV’s advantage in Europe is clear-cut already today: 66–69% fewer life-cycle emissions than a petrol car registered in the same year (ICCT, 2021). Transport & Environment also estimates that direct electrification reaches an overall efficiency of 77%, against 16–20% for a combustion car running on e-fuels: an efficiency argument that bears on the use of scarce renewable electricity.
9. Factors of variability
-
Charging power and mode: this is the variable the user can control most. Charging with an 11 kW wallbox instead of a domestic socket recovers 8–15 percentage points of charging efficiency (ADAC). DC fast charging shifts the losses to the station and to cooling the pack.
-
Temperature: at low temperatures the battery accepts less current, heating the cabin and the pack weighs on consumption, and regenerative braking is limited by the BMS.
-
Speed and cycle: at high speed the efficiency of motor and inverter stays high; what grows is consumption due to aerodynamic drag. In town, by contrast, the EV gains from regenerative braking, where the conventional combustion car is at its minimum.
-
Technology: silicon-carbide inverters, magnet-assisted reluctance motors and batteries with lower internal resistance reduce on-board losses by a few points; on the combustion side, hybridisation is the only lever that moves the TTW significantly.
-
Method: the ranges in this article combine the extremes of the individual parameters and are therefore deliberately wide; a real vehicle under average conditions sits close to the central values.
10. Conclusion
The electric motor is, to all intents and purposes, a given advantage: from the socket to the wheel it is three times as efficient as a combustion engine, and no discussion about power plants calls that into question. The well-to-wheel efficiency, on the other hand, does not belong to the car but to the electricity system that powers it: on electricity from fossil fuels or nuclear the electric car lines up with petrol and stays below diesel; with the 2024 European mix, at 47% renewable, it beats it by a good third; with electricity from sun, wind and water it triples it. When we talk about the efficiency of electric mobility, the right question is not “how efficient is the car?” but “where does the electricity come from?”, and in Europe the answer improves every year.
Sources
-
U.S. Department of Energy, FOTW #1360 (16 September 2024): A Typical EV is 87%–91% Efficient Compared to 30% for a Conventional Gasoline Vehicle. link
-
Huss A. et al., JEC Tank-to-Wheel report v5: Passenger cars, JRC 2020, doi 10.2760/557004 (charging losses 20% in 2015, 15% in 2025+). link
-
Prussi M. et al., JEC Well-To-Wheels report v5 and Well-to-Tank report v5, JRC/EUCAR/Concawe 2020, doi 10.2760/100379 and 10.2760/959137. link
-
Albatayneh A. et al., Comparison of the Overall Energy Efficiency for Internal Combustion Engine Vehicles and Electric Vehicles, Environmental and Climate Technologies 24(1):669–680, 2020, doi 10.2478/rtuect-2020-0041. link
-
Ember, European Electricity Review 2025 – 2024 at a glance (2024 EU electricity mix). link
-
CEER, 3rd CEER Report on Power Losses in European Electricity Grids, February 2025 (2013–2022 data). link
-
ADAC, AC charging-loss tests on five electric vehicles (2026), as reported by ecomento.de (in German). link
-
IEA, Statistics questionnaires FAQ – physical energy content method (nuclear at 33%, hydro at 100%). link
-
IEA Clean Coal Centre, HELE deployment in the coal power plant fleets of China, EU, Japan and USA (2016), via POWER Magazine; EIA, combined-cycle heat rates (2022), via Power Engineering. link
-
Bieker G., A global comparison of the life-cycle greenhouse gas emissions of combustion engine and electric passenger cars, ICCT 2021 (updated 2022). link
-
Transport & Environment Italia, Carburanti biologici e sintetici: tutto ciò che bisogna sapere (biofuels and synthetic fuels: everything you need to know, in Italian), March 2023. link